

Analytics
Use Synthesia's video analytics to understand how viewers interact with your content.
After you've published a generated video, you'll have access to video analytics from the overview page:

Video analytics are only available for videos shared via Synthesia's video player—this includes videos shared via embeds, SCORM packages, and the video's share page link. Analytics aren't available for video content that's been downloaded as an .mp4 and uploaded into another platform.
Select Analytics at the top of the page to open the full-page analytics experience for a given version of a video. Which tabs you see depends on the video type:
- Videos without interactive elements, and dubbing projects, show Adoption.
- Interactive videos with buttons, but no quiz, also show Adoption—button metrics live there too, grouped under Engagement, since they're aggregate numbers rather than tracked separately.
- Videos with quizzes show Adoption, Questions, and Results.
- Roleplay Sessions show Adoption and Results.

You can filter the data using:
- Version: A specific version, or all versions. Defaults to the currently published version.
- Time range: The lifetime of the version, or the last 30 days.
- Interval: How the data is broken down over that time range—Daily, Weekly, Monthly, or Yearly.
- Language: If the video has been dubbed or translated, filter to a specific language.
Adoption
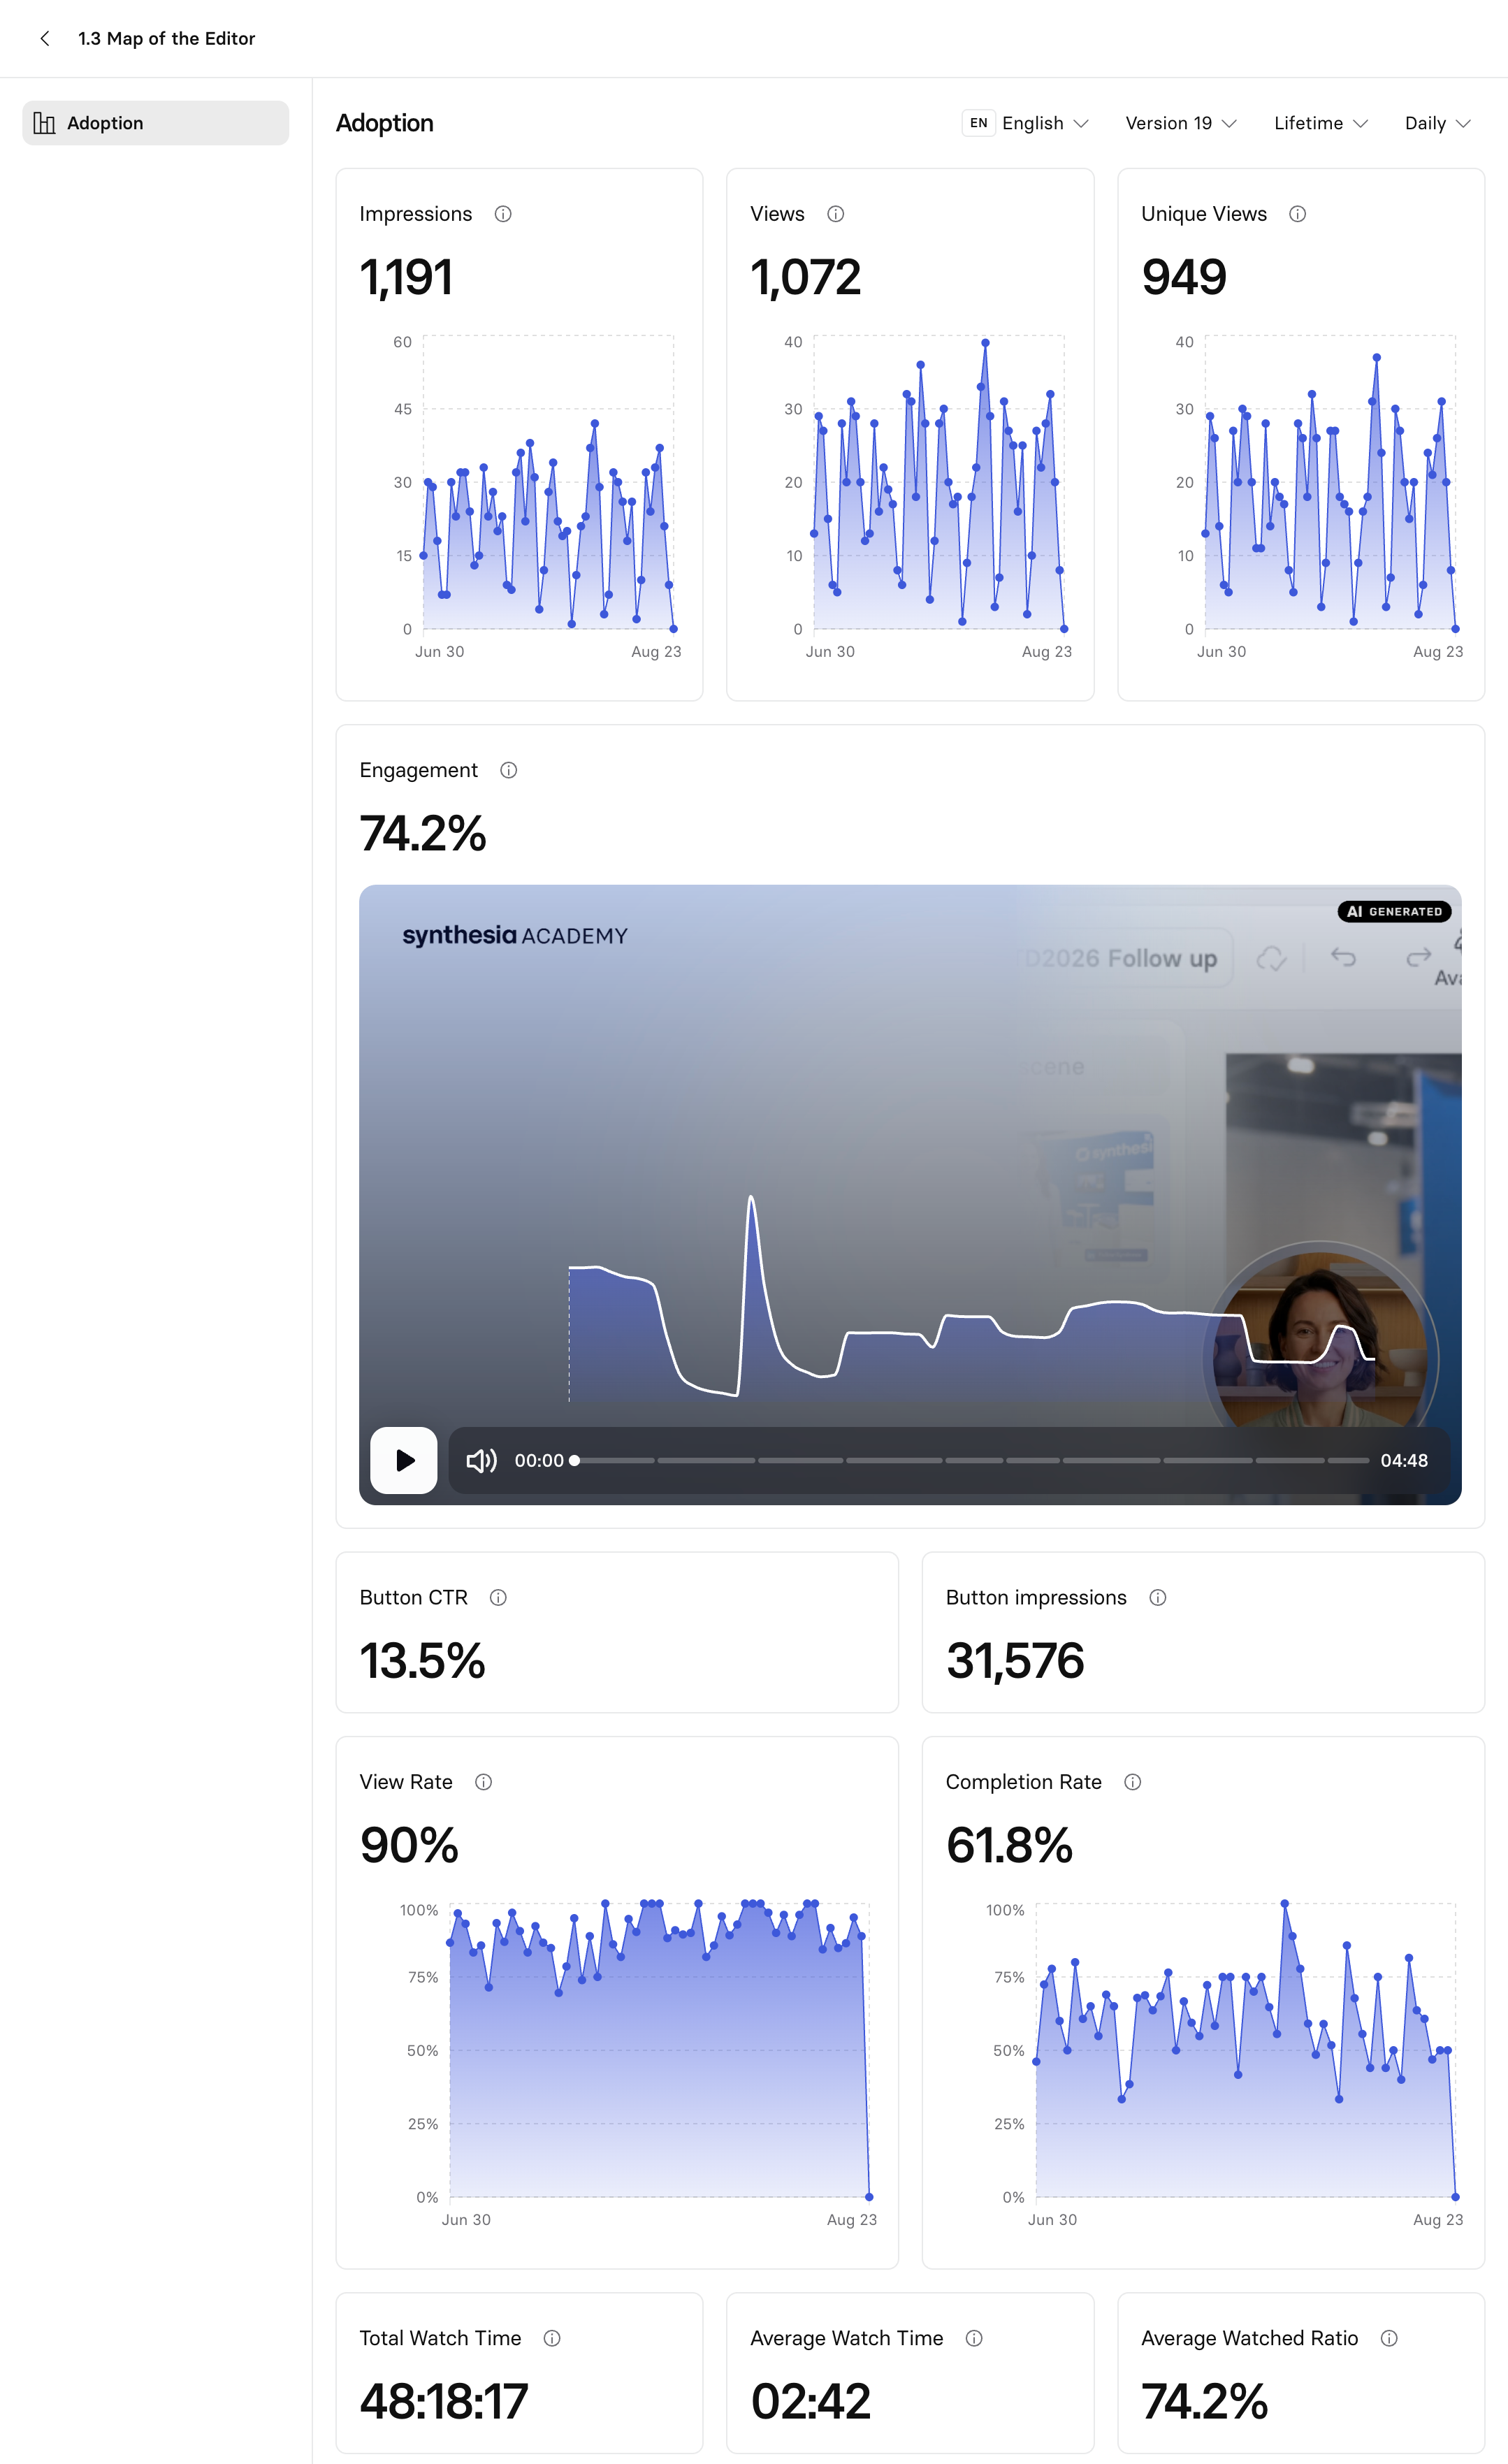
Note:Engagement isn't available when
All versionsis selected. Different versions of a video can have different content and lengths, so an average percentage watched across all of them wouldn't be meaningful.
| Metric | Description |
|---|---|
| Impressions | Number of times your video was displayed (for example, showed up in a feed). |
| Views | Total number of times the video has been viewed. |
| Unique viewers | Number of distinct people who have watched the video—multiple views don't count. |
| Engagement | Average percentage of video content watched by viewers. |
| View rate | Percentage of impressions that resulted in a view. |
| Completion rate | Percent of views where 95% or more of the video was watched. |
| Total watch time | Total collective time users spent watching the video. |
| Avg. watch time | Average time (in minutes and seconds) a user watched the video. |
| Average Watched Ratio | Average percentage of video content watched by viewers. |
Note:For interactive videos, completion rate depends on how the video is set up: if it has clickable buttons, a scene needs to be designated as the end of the video for it to be marked complete; if it's a quiz, a results component needs to be added. Without one of these, an interactive video can't be marked complete at all. See Interactivity to learn more.
For interactive videos with buttons, Adoption also includes these metrics, grouped under Engagement:
| Metric | Description |
|---|---|
| Button CTR | The percentage of interactivity button impressions that resulted in a click. |
| Button impressions | The number of times an interactivity button was displayed. |
Questions
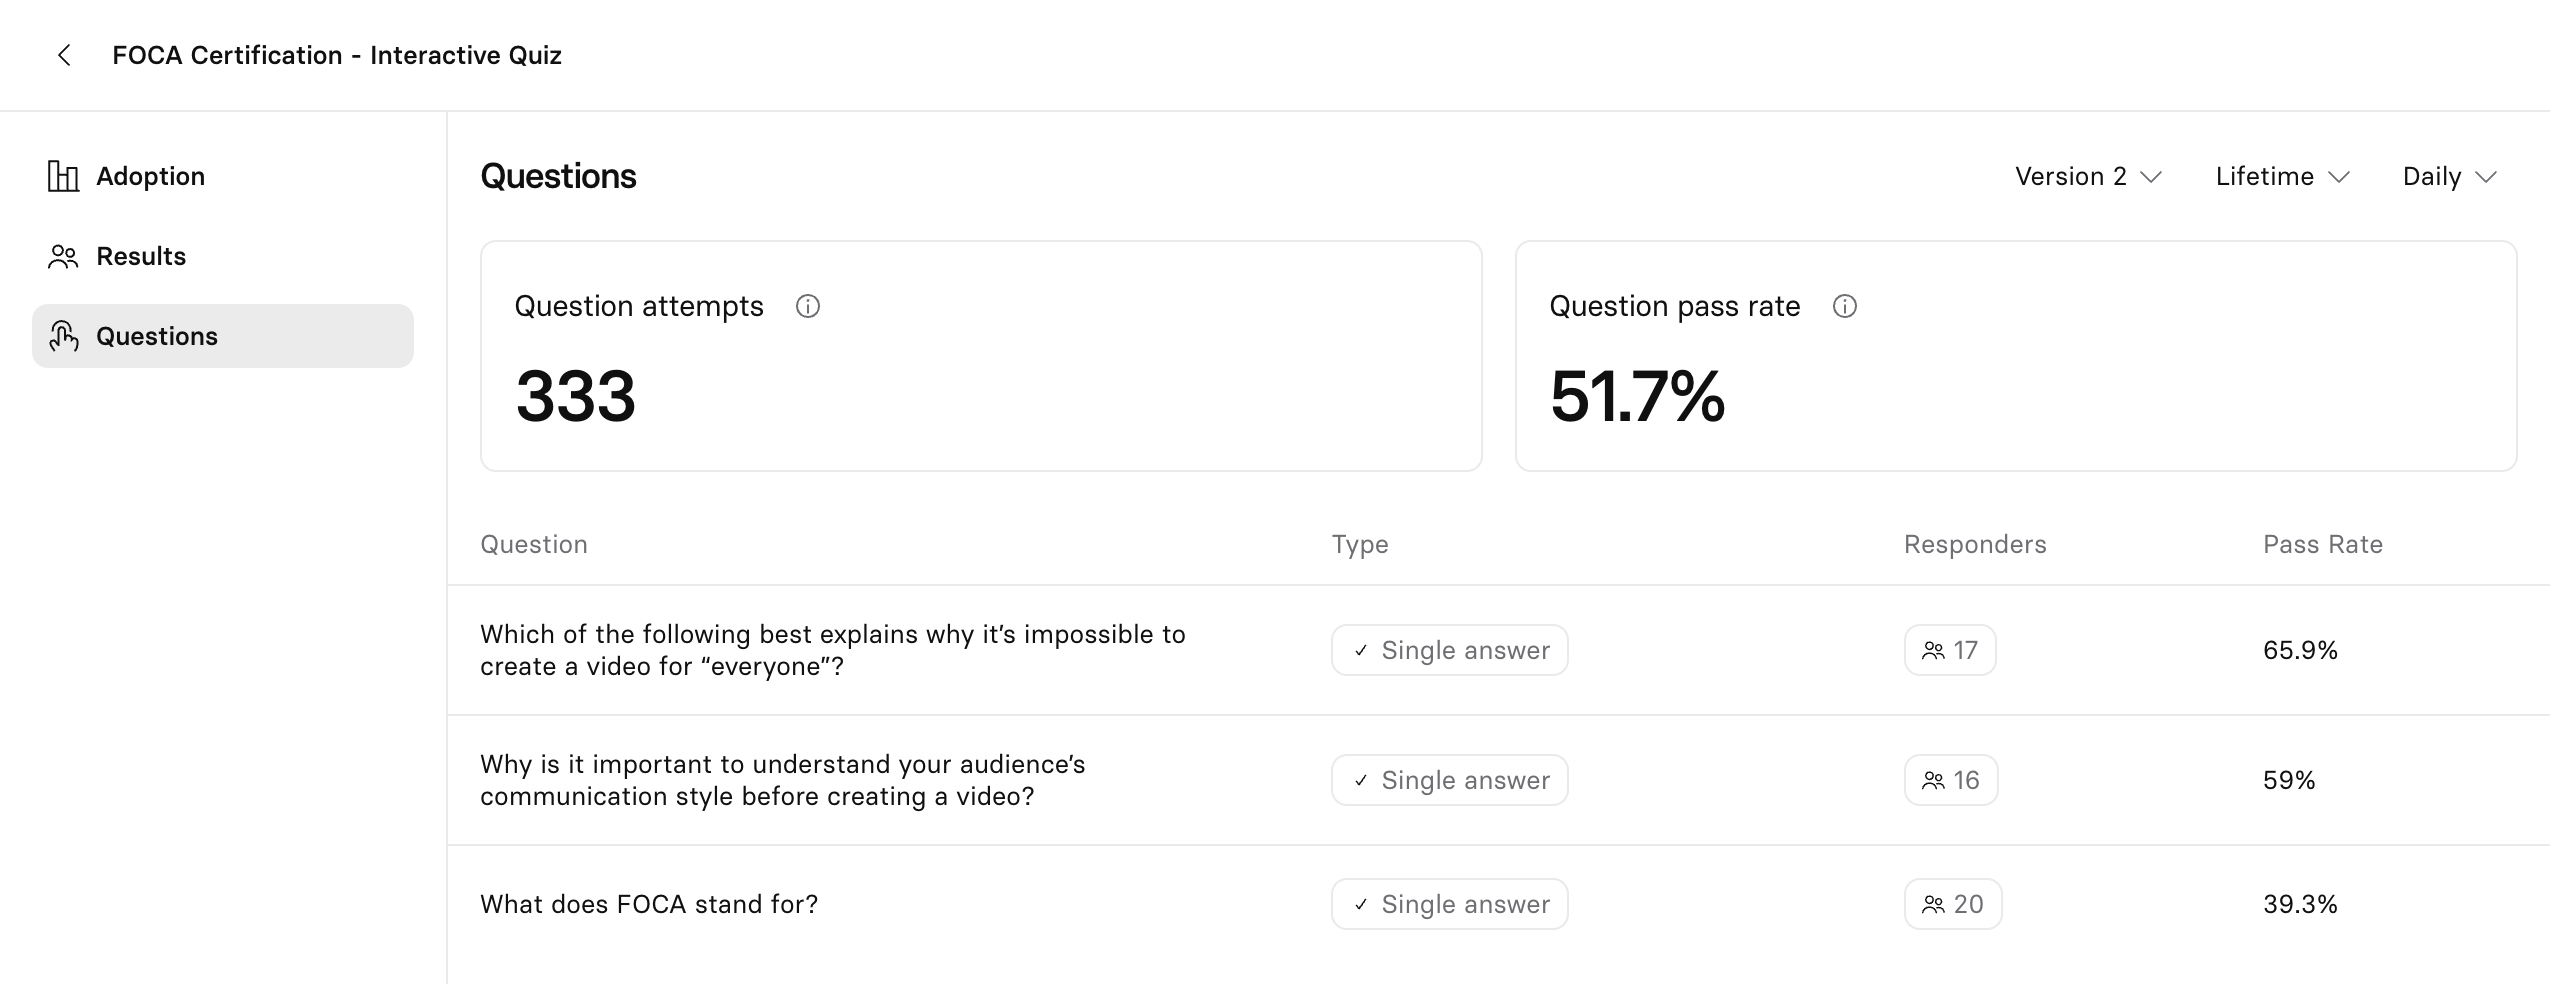
Available for videos with quizzes, with the same filters as Adoption:
| Metric | Description |
|---|---|
| Question attempts | Total number of times users responded to a question. |
| Question pass rate | Percentage of correct responses to questions relative to all responses. |
| Quiz attempts | Total number of times users attempted to answer the quiz. |
| Quiz pass rate | Percentage of quizzes passed relative to quiz completions. |
Results
The Results tab shows how individual learners performed—on the quizzes in your video, or in a Roleplay Session. Use it to see the spread of scores across your audience, drill into any learner's attempt history, and export the raw data.
Note:This section primarily focuses on the metrics available for quizzes. For in-depth documentation on analytics for Roleplay Sessions, see Manage > Analytics > Results.
Results filters by Language and Version, like the other tabs, but has no Interval filter, since it shows per-learner data rather than a time series.
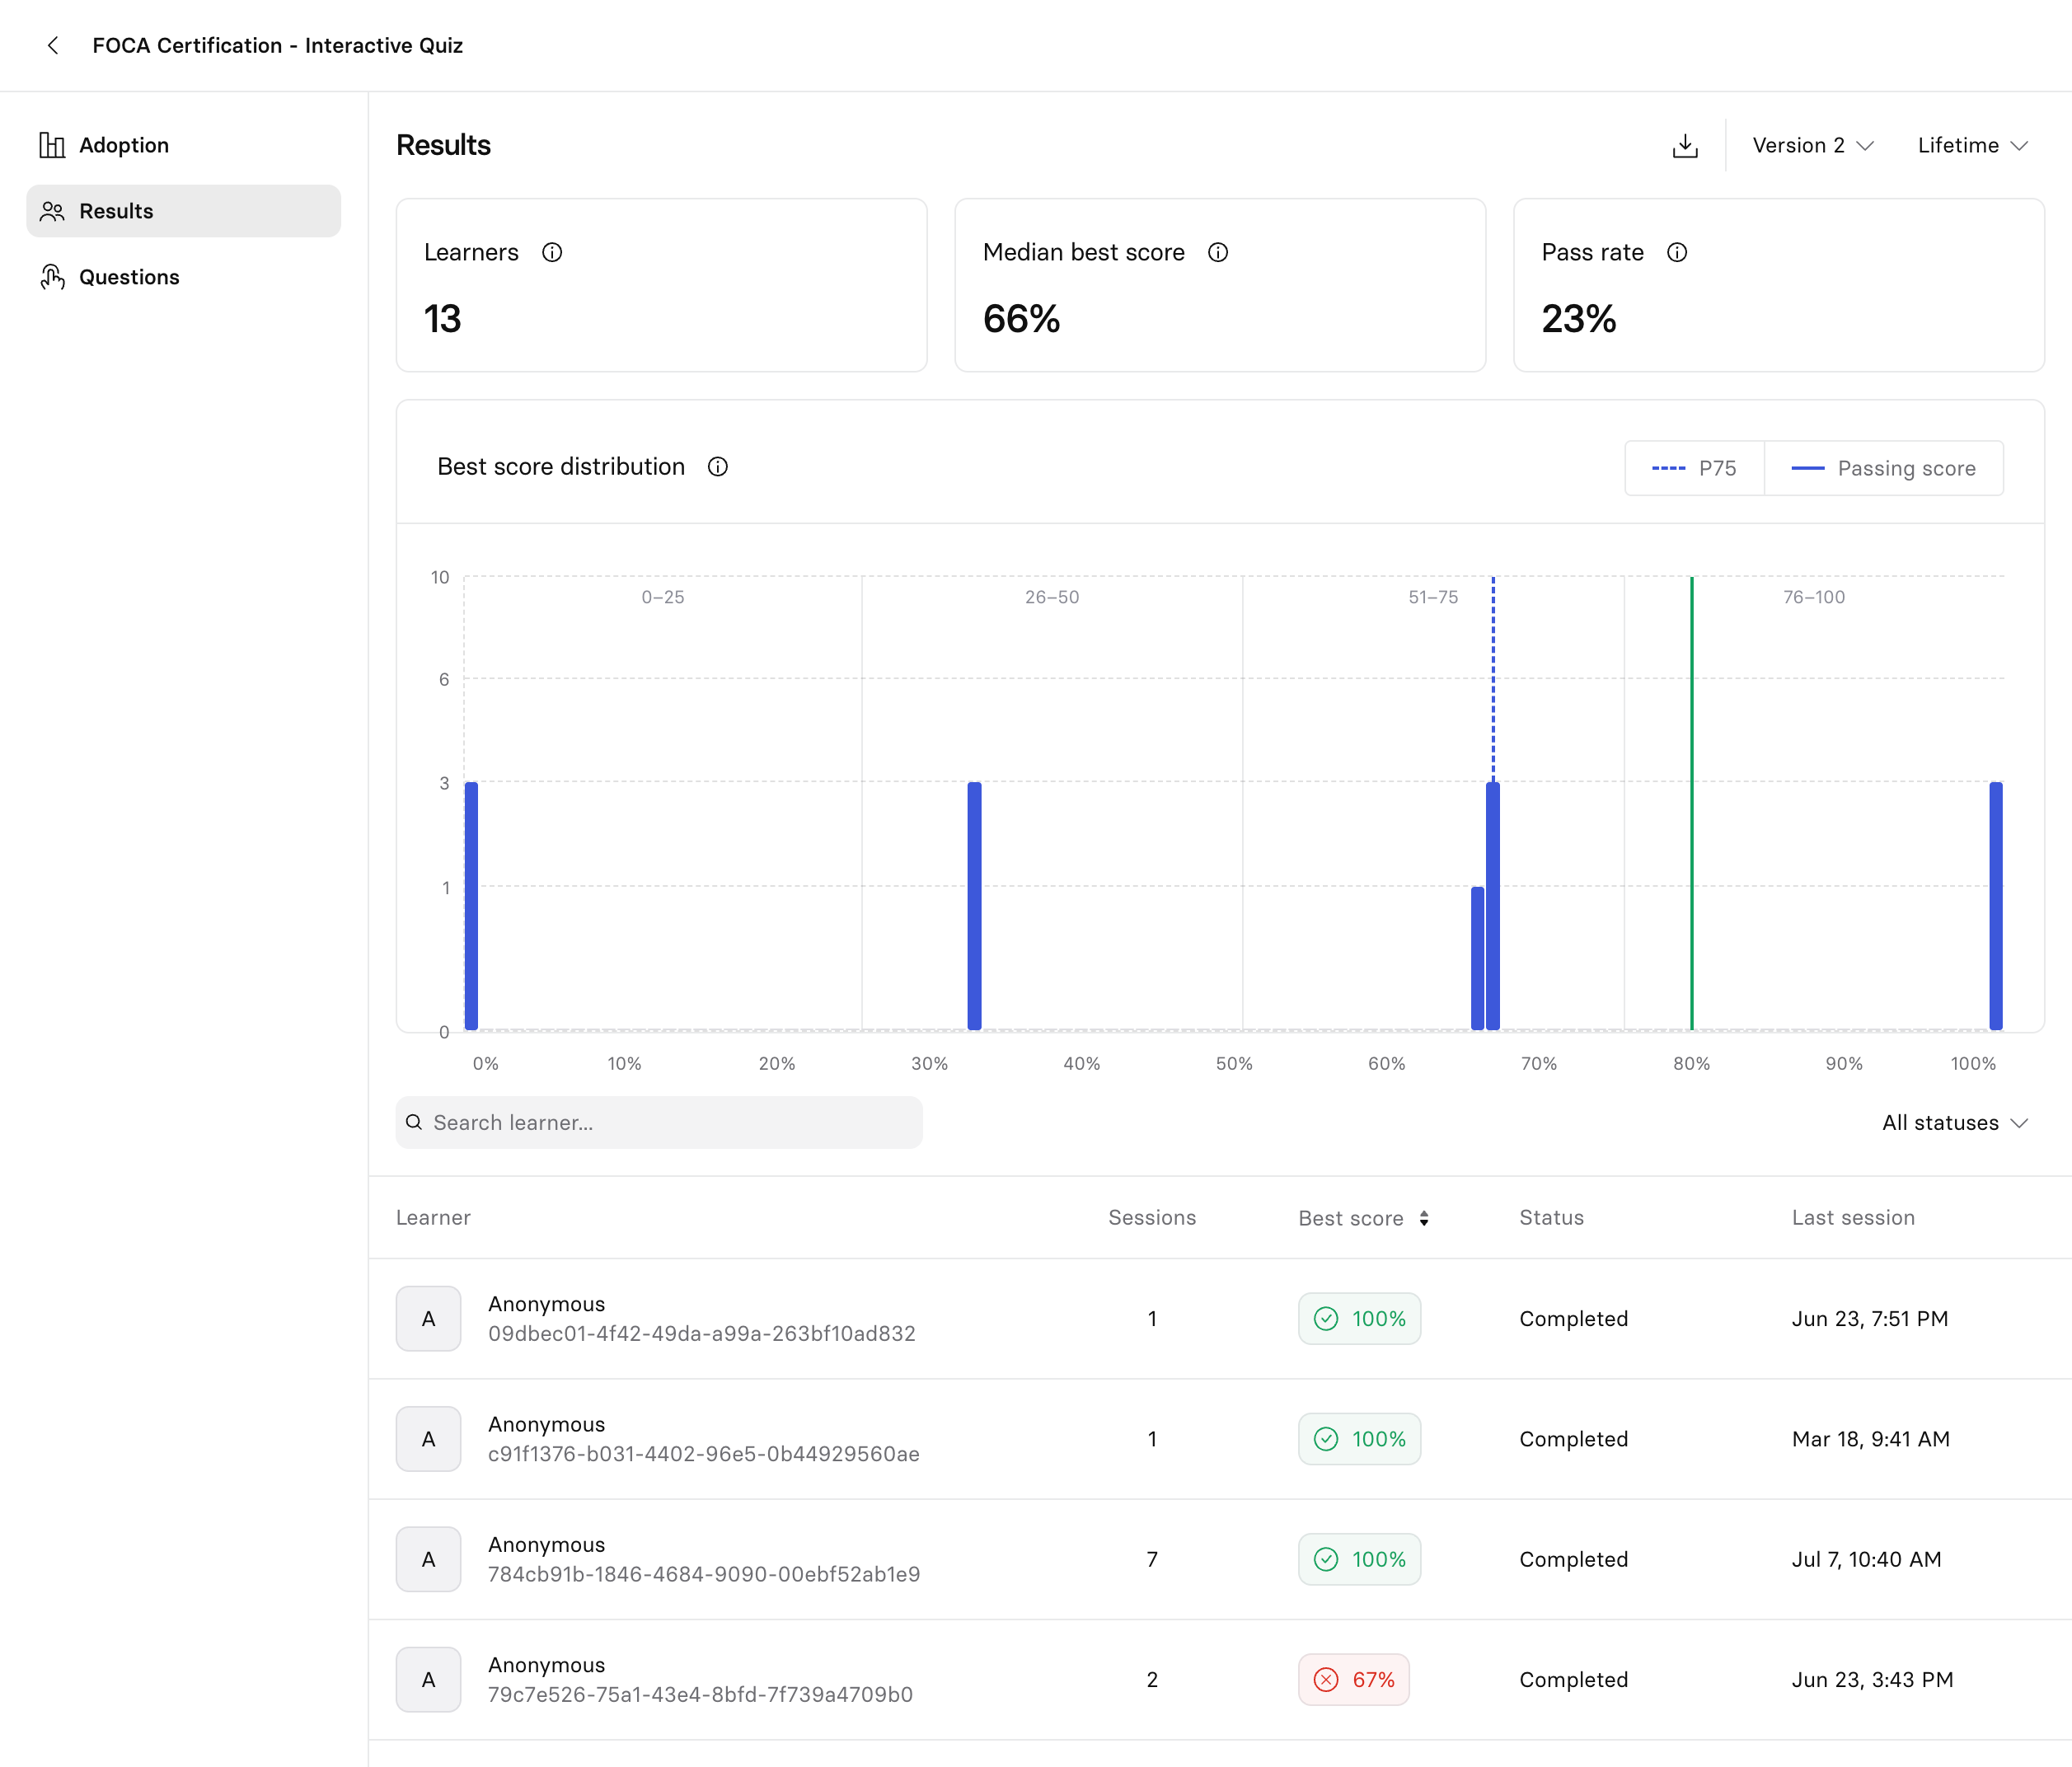
Note:Learners aren't identified by default. You'll see them listed as Anonymous, with a unique identifier to differentiate them. To record learner identity (name and email address), enable
Record Learner Identitywhen downloading the SCORM package, or turn onRequire SSO to watchin Advanced settings.
| Metric | Description |
|---|---|
| Learners | The number of distinct learners who completed the assignment. |
| Median best score | Each learner's highest score, taken at the midpoint across all learners. |
| Pass rate | Share of learners who reached the passing score in at least one attempt. |
Score distribution chart: A chart plots every learner's best session score across the full range, with the passing score threshold marked. Select a band to filter the learner table to that group.
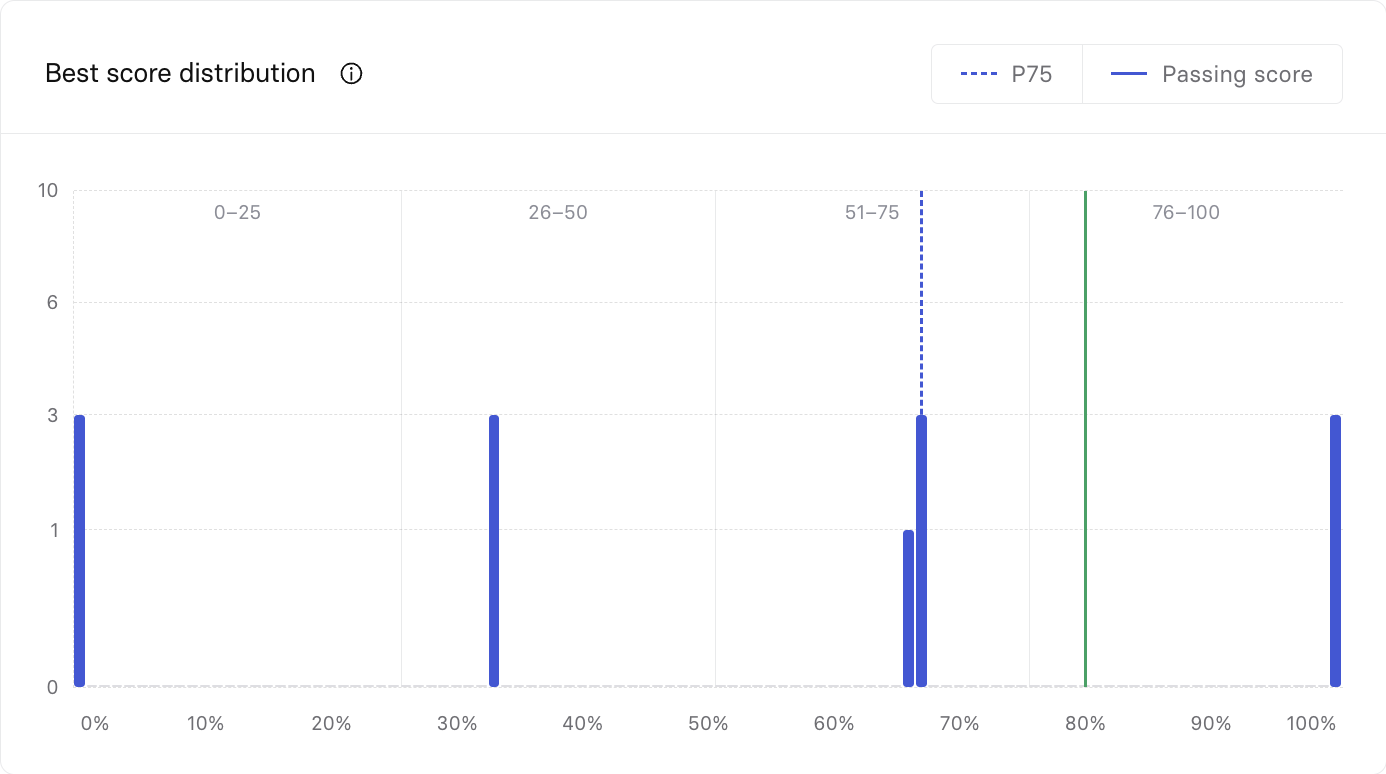
Learner data table: A table lists each learner with their best score, completion status, attempt count, and last attempt date. Filter by completion status, sort by score, or search by name.
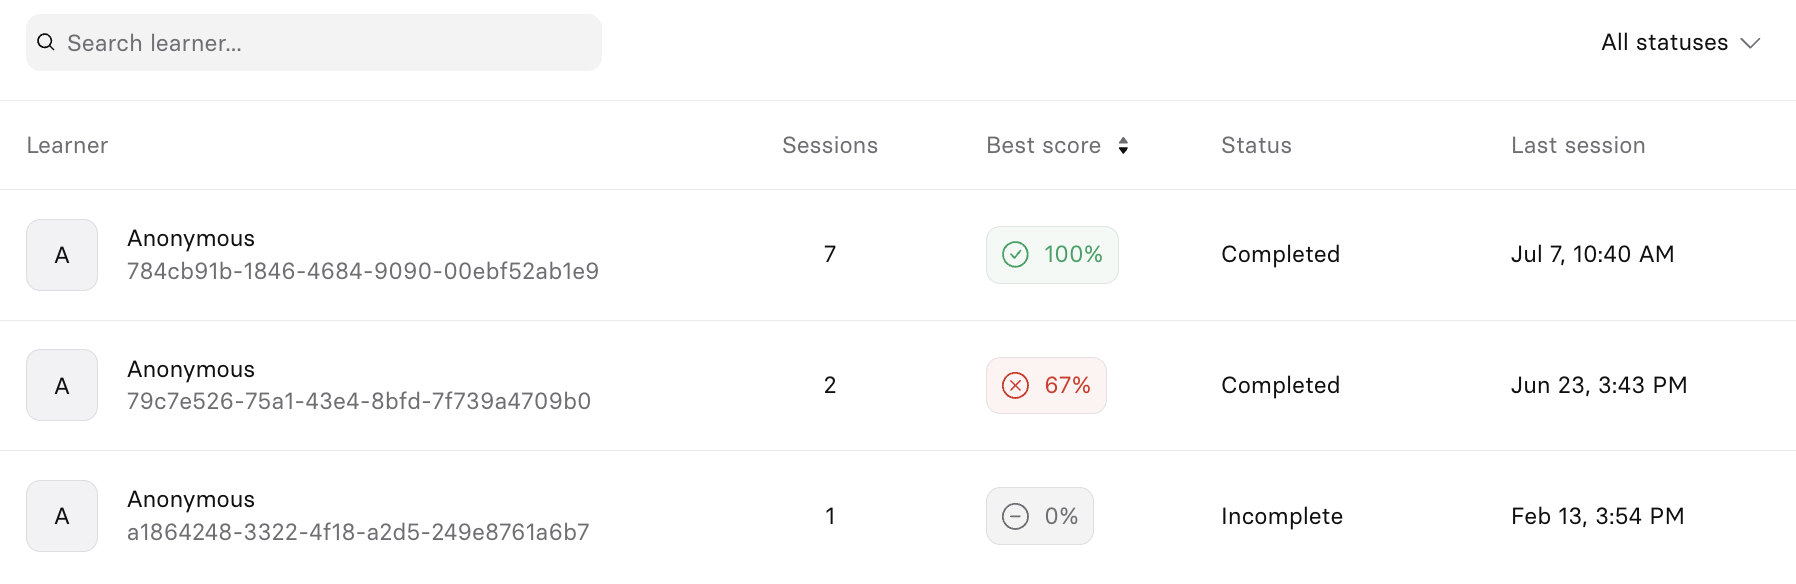
Learner table metrics:
| Metric | Description |
|---|---|
| Learner | Learner's name or anonymous identifier. |
| Session | Number of attempts the learner has made. |
| Best score | Learner's highest score across all attempts. |
| Status | Whether the learner has completed the quiz. |
| Last session | Date and time of the learner's most recent attempt. |
Individual learner data
Select any learner to open their history:
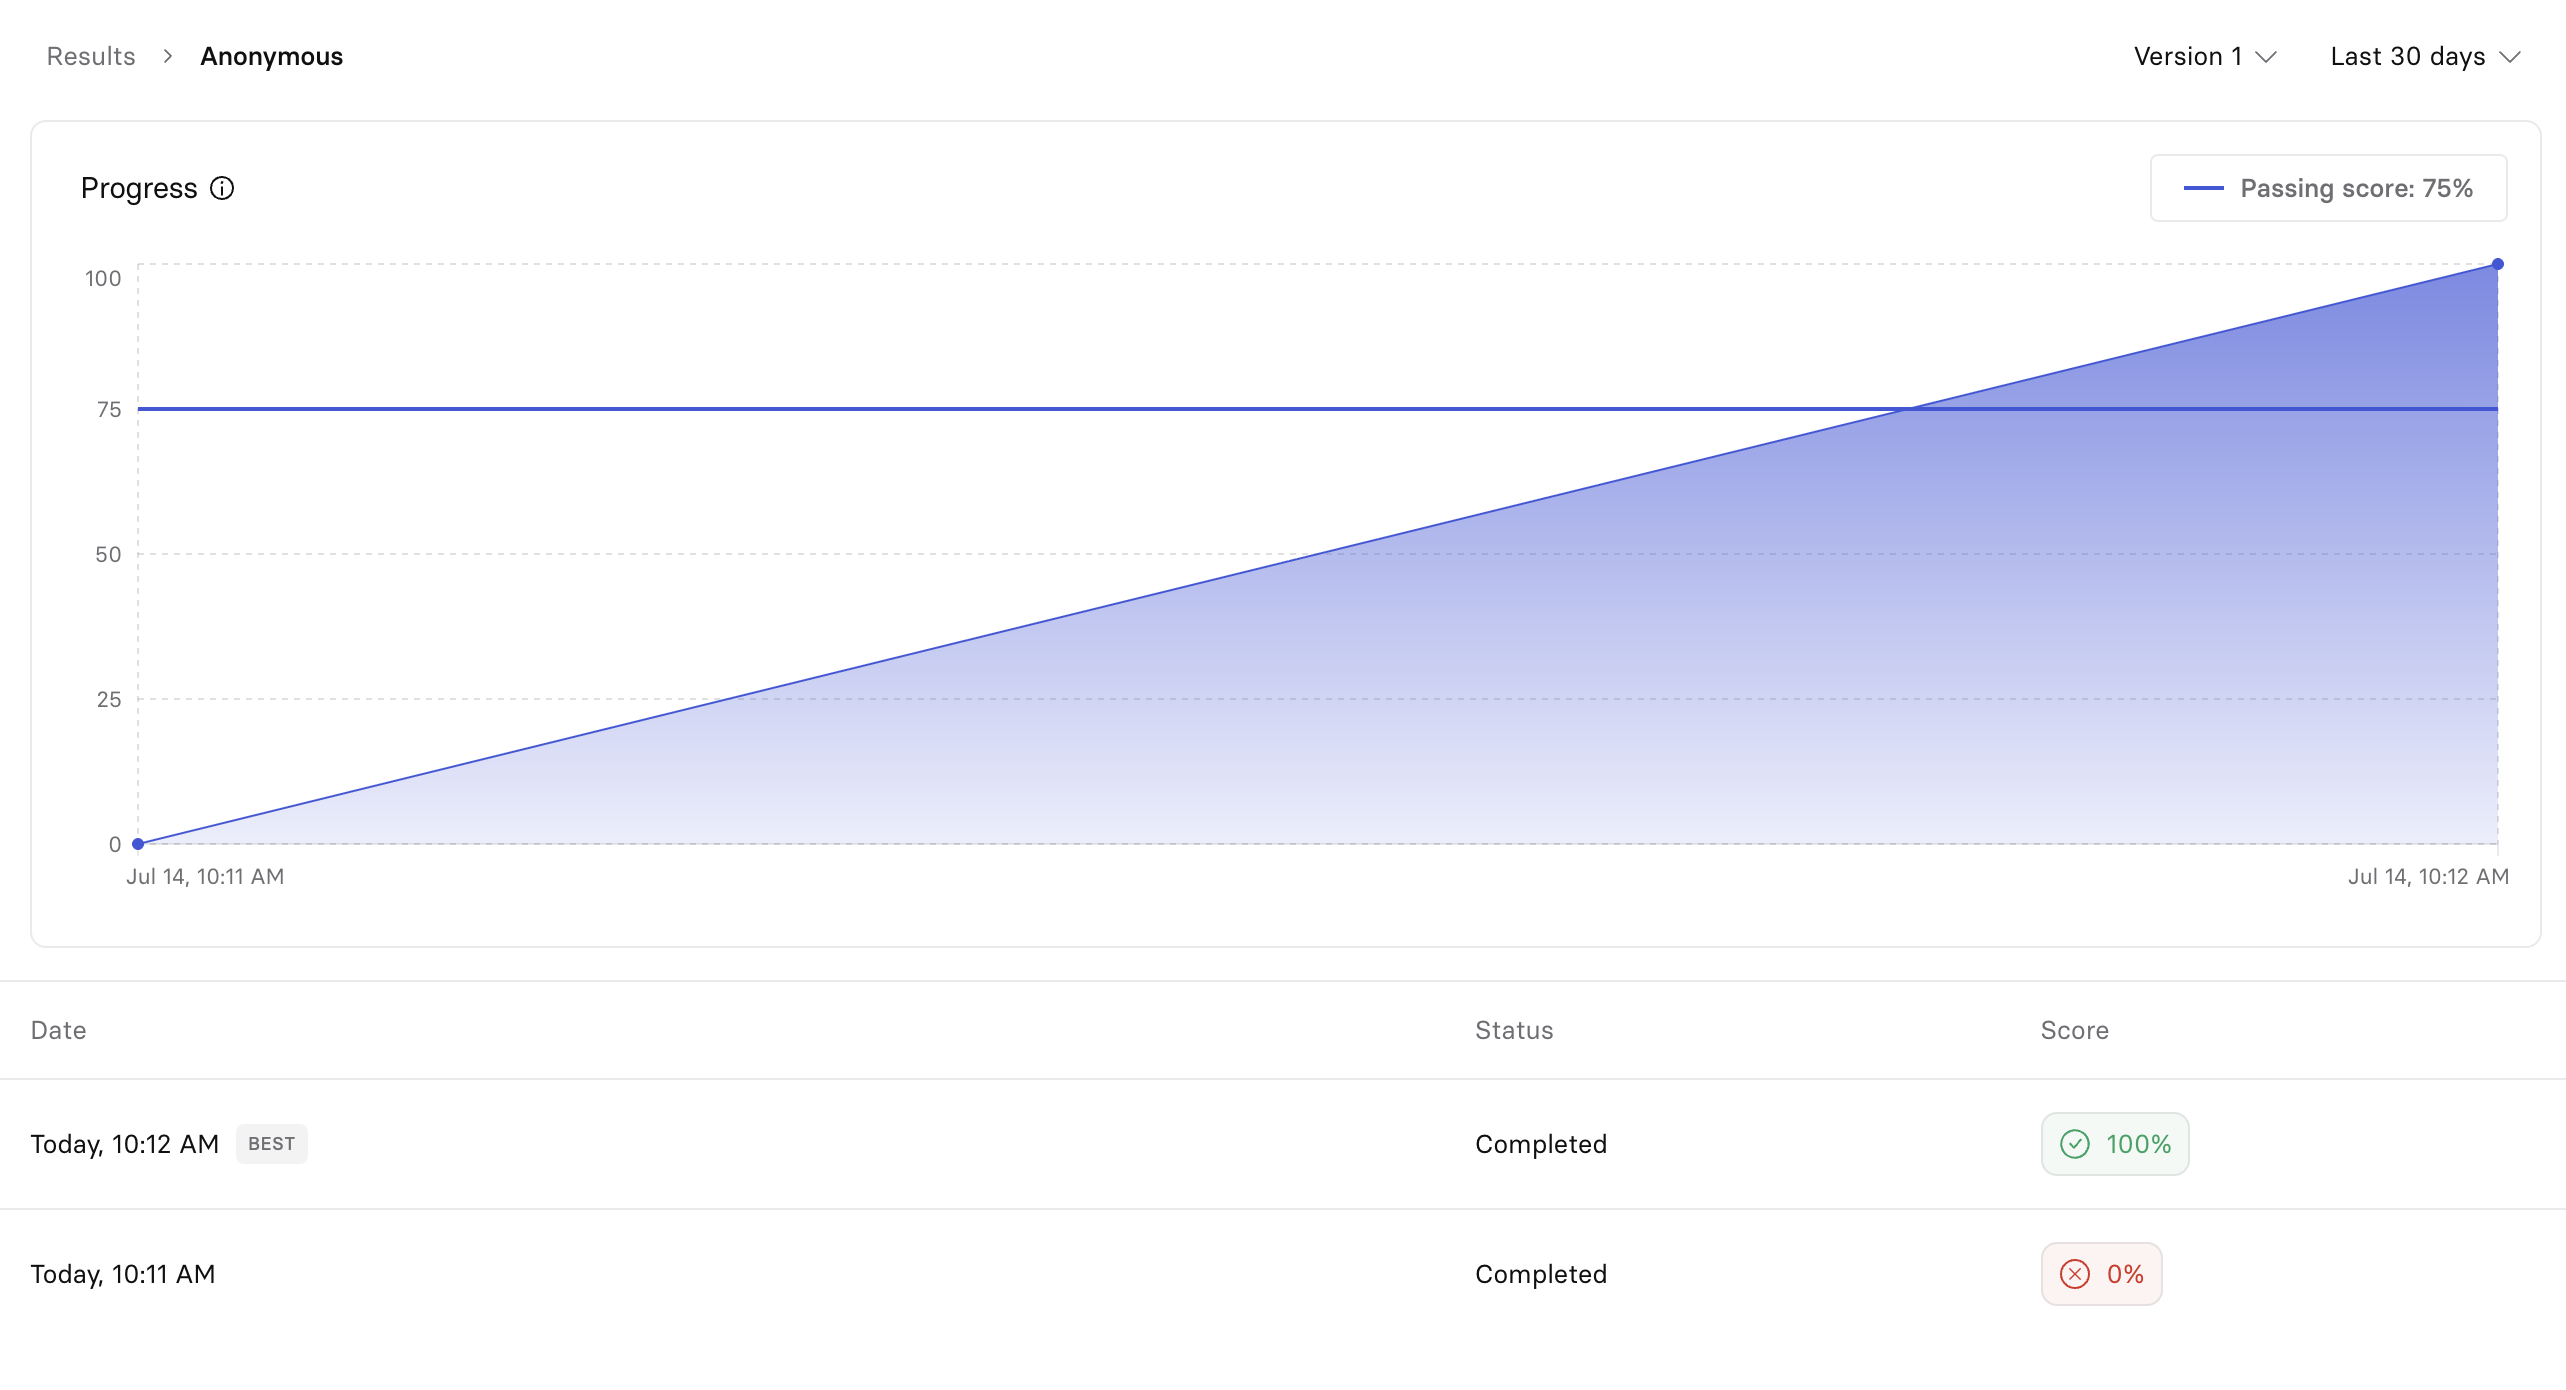
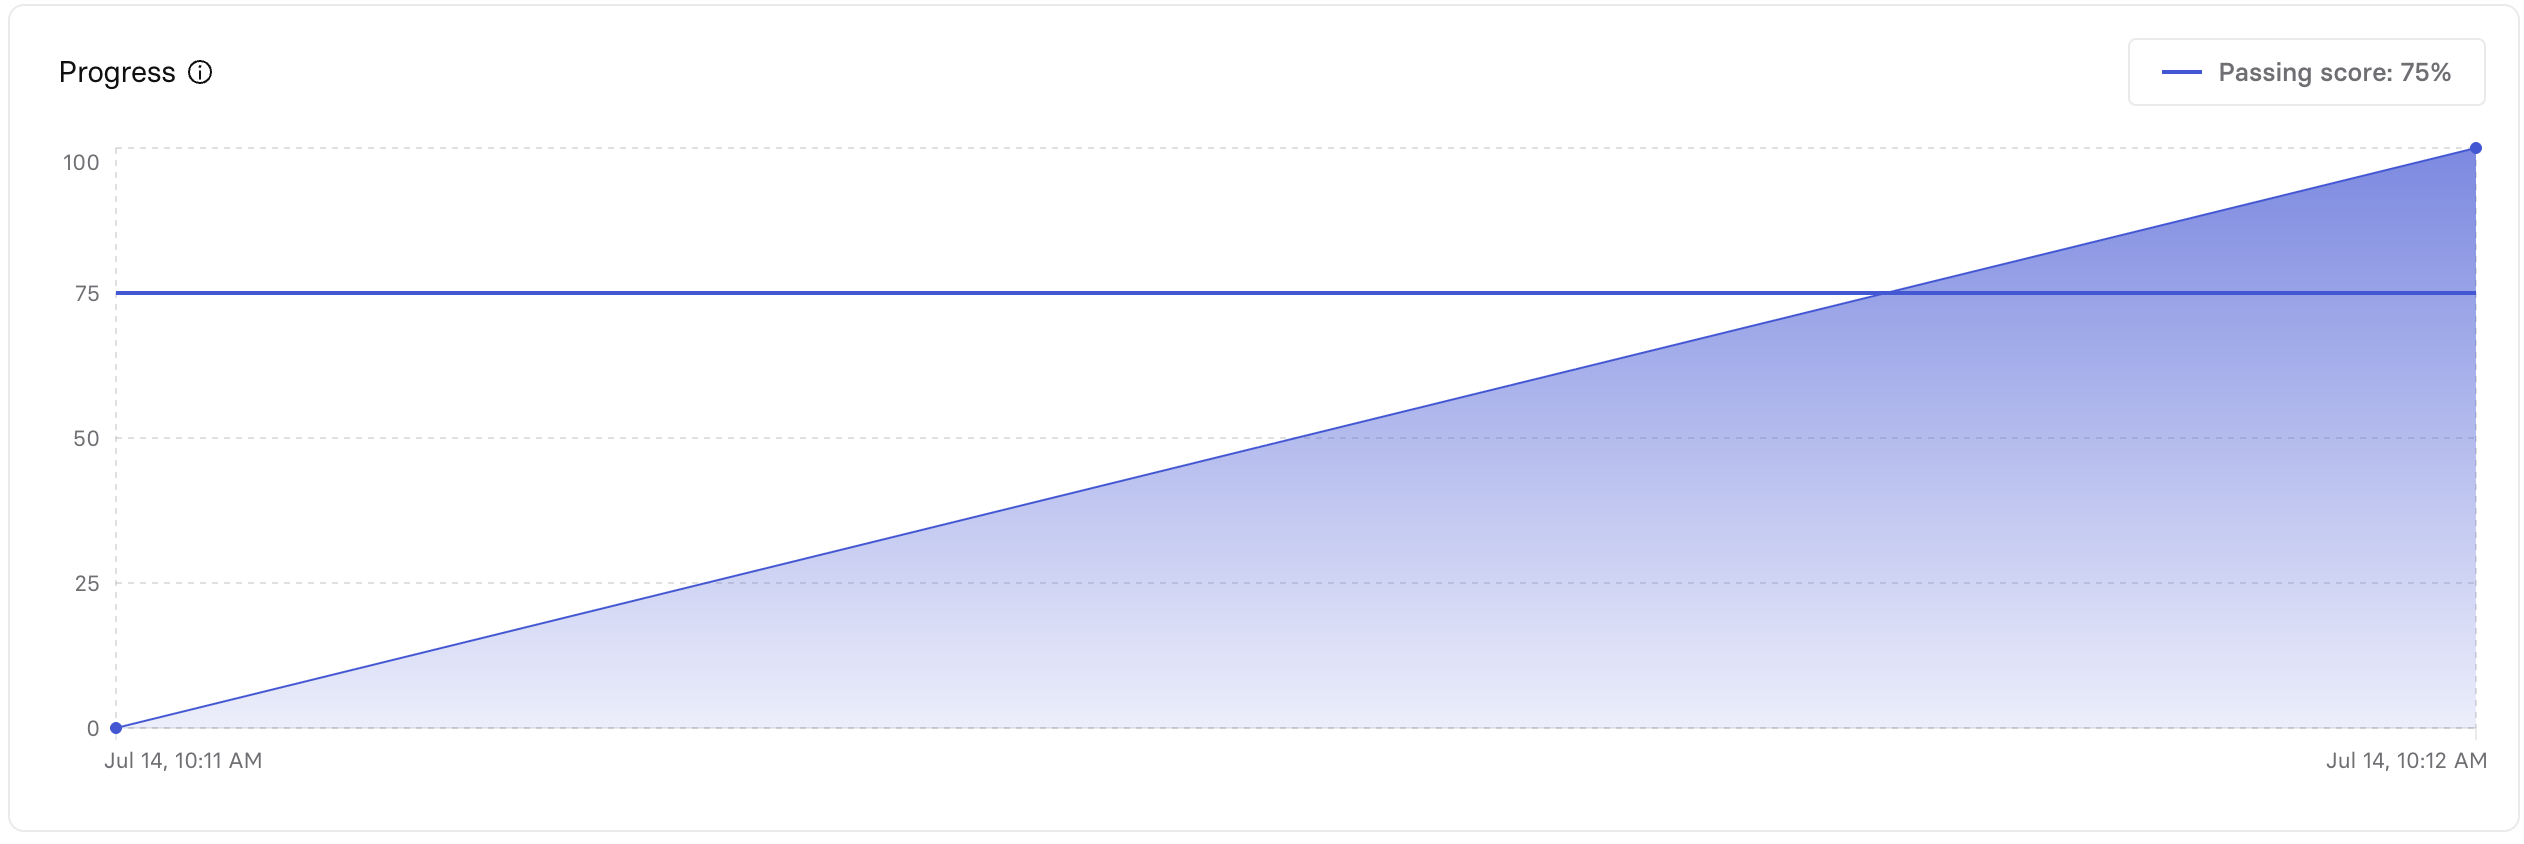
Progress: a chart plotting the learner's score across sessions, with the passing score marked as a reference line.
Sessions: each session listed with its date, status, and score. The highest-scoring session is tagged BEST.

Quiz results: select any session for the overall score, whether the learner passed, and their response to each question.
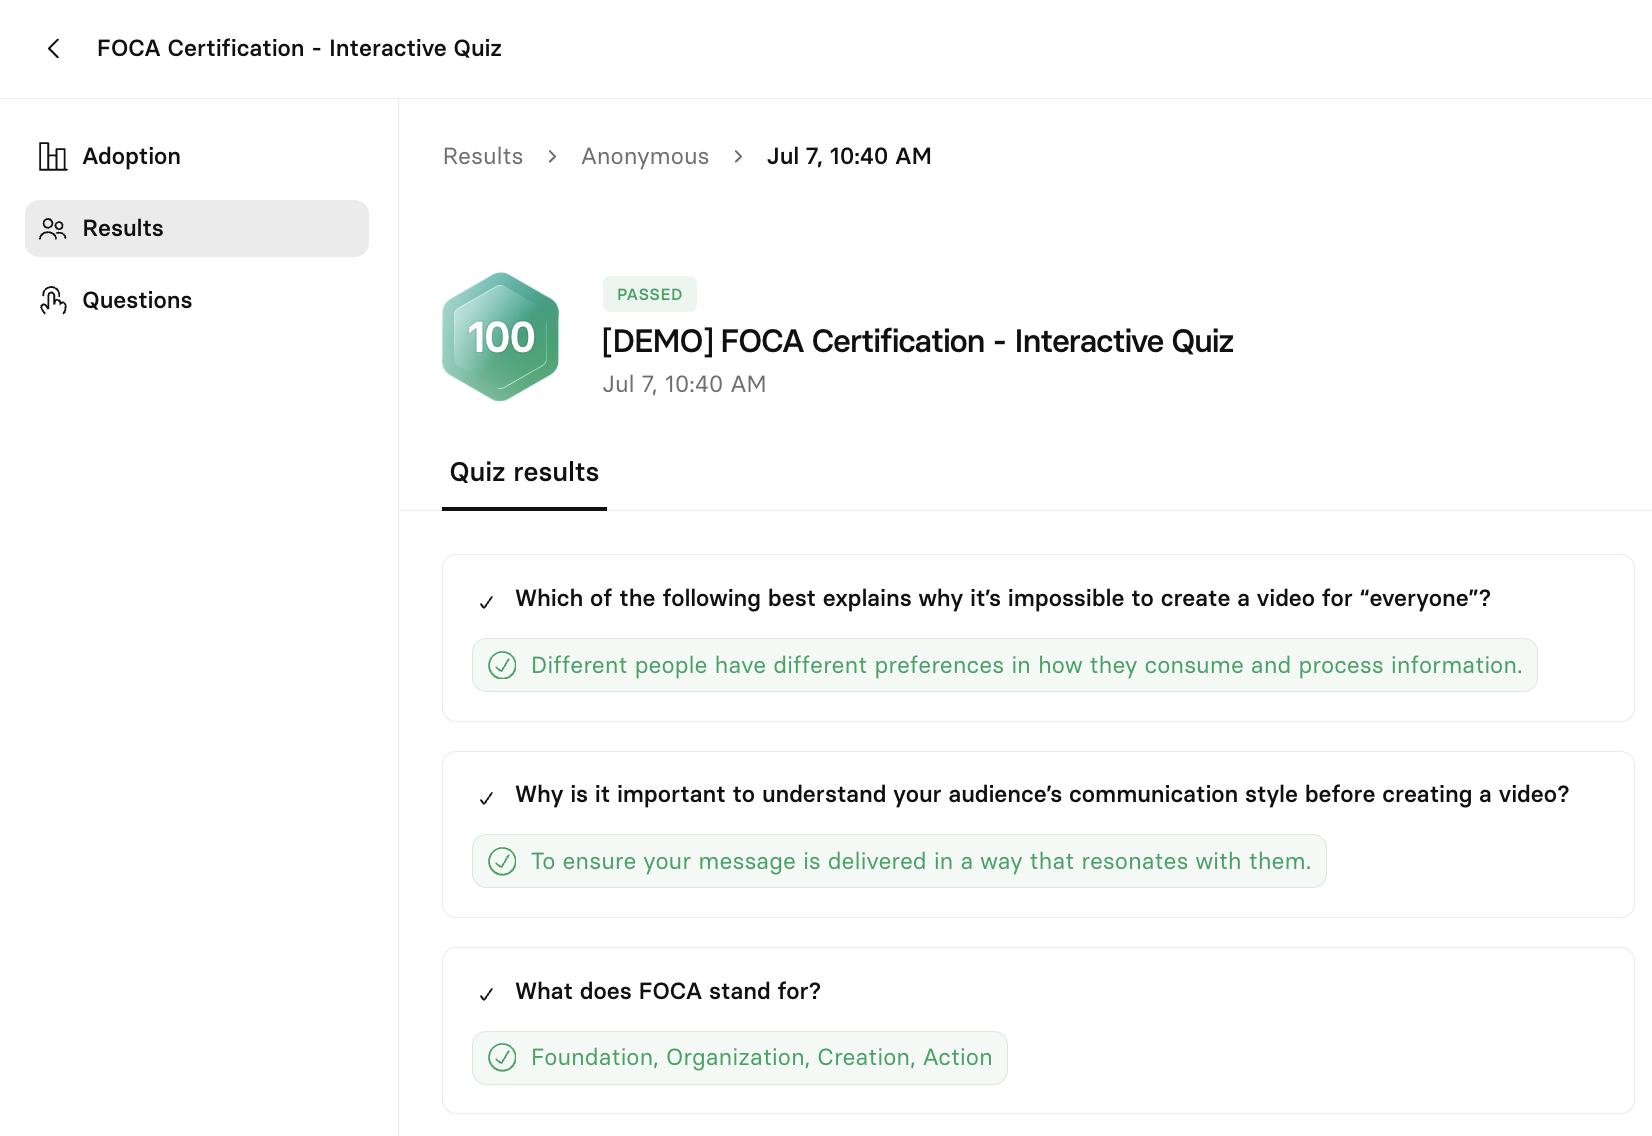
Export learner data
Export the raw session data for a quiz to analyze it outside Synthesia or share it with stakeholders who don't have access to the analytics page.
- Open the Results tab of the video analytics page.
- Select the download icon at the top of the tab (
Request CSV).
The export is generated in the background and sent to your login email as a .zip file, usually within a few minutes (up to 15). The CSV inside contains one row per session, with each learner's score, status, date, and question-level responses.
Updated 17 days ago